
Simplify Your Demand Planning Process with Pyramid Forecasting in SAP IBP

Demand planning can be a challenging process for companies with complex product hierarchies that have numerous product groups, product families, and stock keeping units. To further complicate the issue, demand planning often involves forecasting for different customer channels and individual customers within those channels. Clearly, companies need a way to navigate through these complexities when it comes to forecasting demand. That’s where Pyramid Forecasting comes into play, along with the technical capabilities offered in SAP IBP for managing this process.
Ensuring Cross-Departmental Forecast Alignment
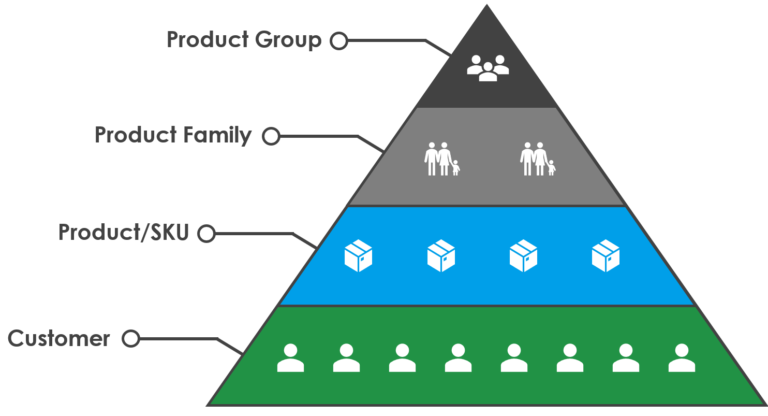
The concept of Pyramid Forecasting allows supply chain planners to start with a forecast at the highest level of a product hierarchy and disaggregate the forecast down into lower levels. Thus, the name pyramid implies starting at the apex and working down to the ground level.
A common example where Pyramid Forecasting is used is when a finance team produces a forecast at a high level, say Product Group, and hands that forecast off to the supply chain team to split the forecast into lower levels needed for proper demand and supply planning. The Pyramid concept ensures that regardless of how the Supply Chain team chooses to split (disaggregate) the forecast into lower levels, the final forecasts will add-up (aggregate) to the original forecast planned at the Product Group level.
Proportional Factors in IBP
In SAP IBP, supply chain planners can split forecasts from higher to lower levels by utilizing ‘proportional factor’ key figures. These proportional factors determine the share of a forecast that each product family will receive from a product group as a result of disaggregation.
For example, let’s say I have a forecast of 1,000 units for a Product Group called Soft Drinks. Soft Drinks contains two Product Families: Cola and Lemon Lime. In SAP IBP, I can review my sales history for these two Product Families and determine that Cola averages 60% of the Soft Drinks sales and Lemon Lime averages 40%. Hence, in IBP I’ll assign a proportional factor of 60% for Cola and 40% for Lemon Lime and utilize a Disaggregation Operator to split the Product Group into my two Product Families based on the proportional factor key figures. The result will be a forecast of 600 units of Cola and 400 units for Lemon Lime. From there, I can split my Product Family forecasts at lower levels such as Product/SKU, Channel, Customer, etc.
Take a look at our Five Minute Feature video to see Pyramid Forecasting in action.